
如何在 Microsoft Excel 中使用图表和图形模板
在浏览器中,探索 Excel 图表模板
双击要使用的图表或图形模板
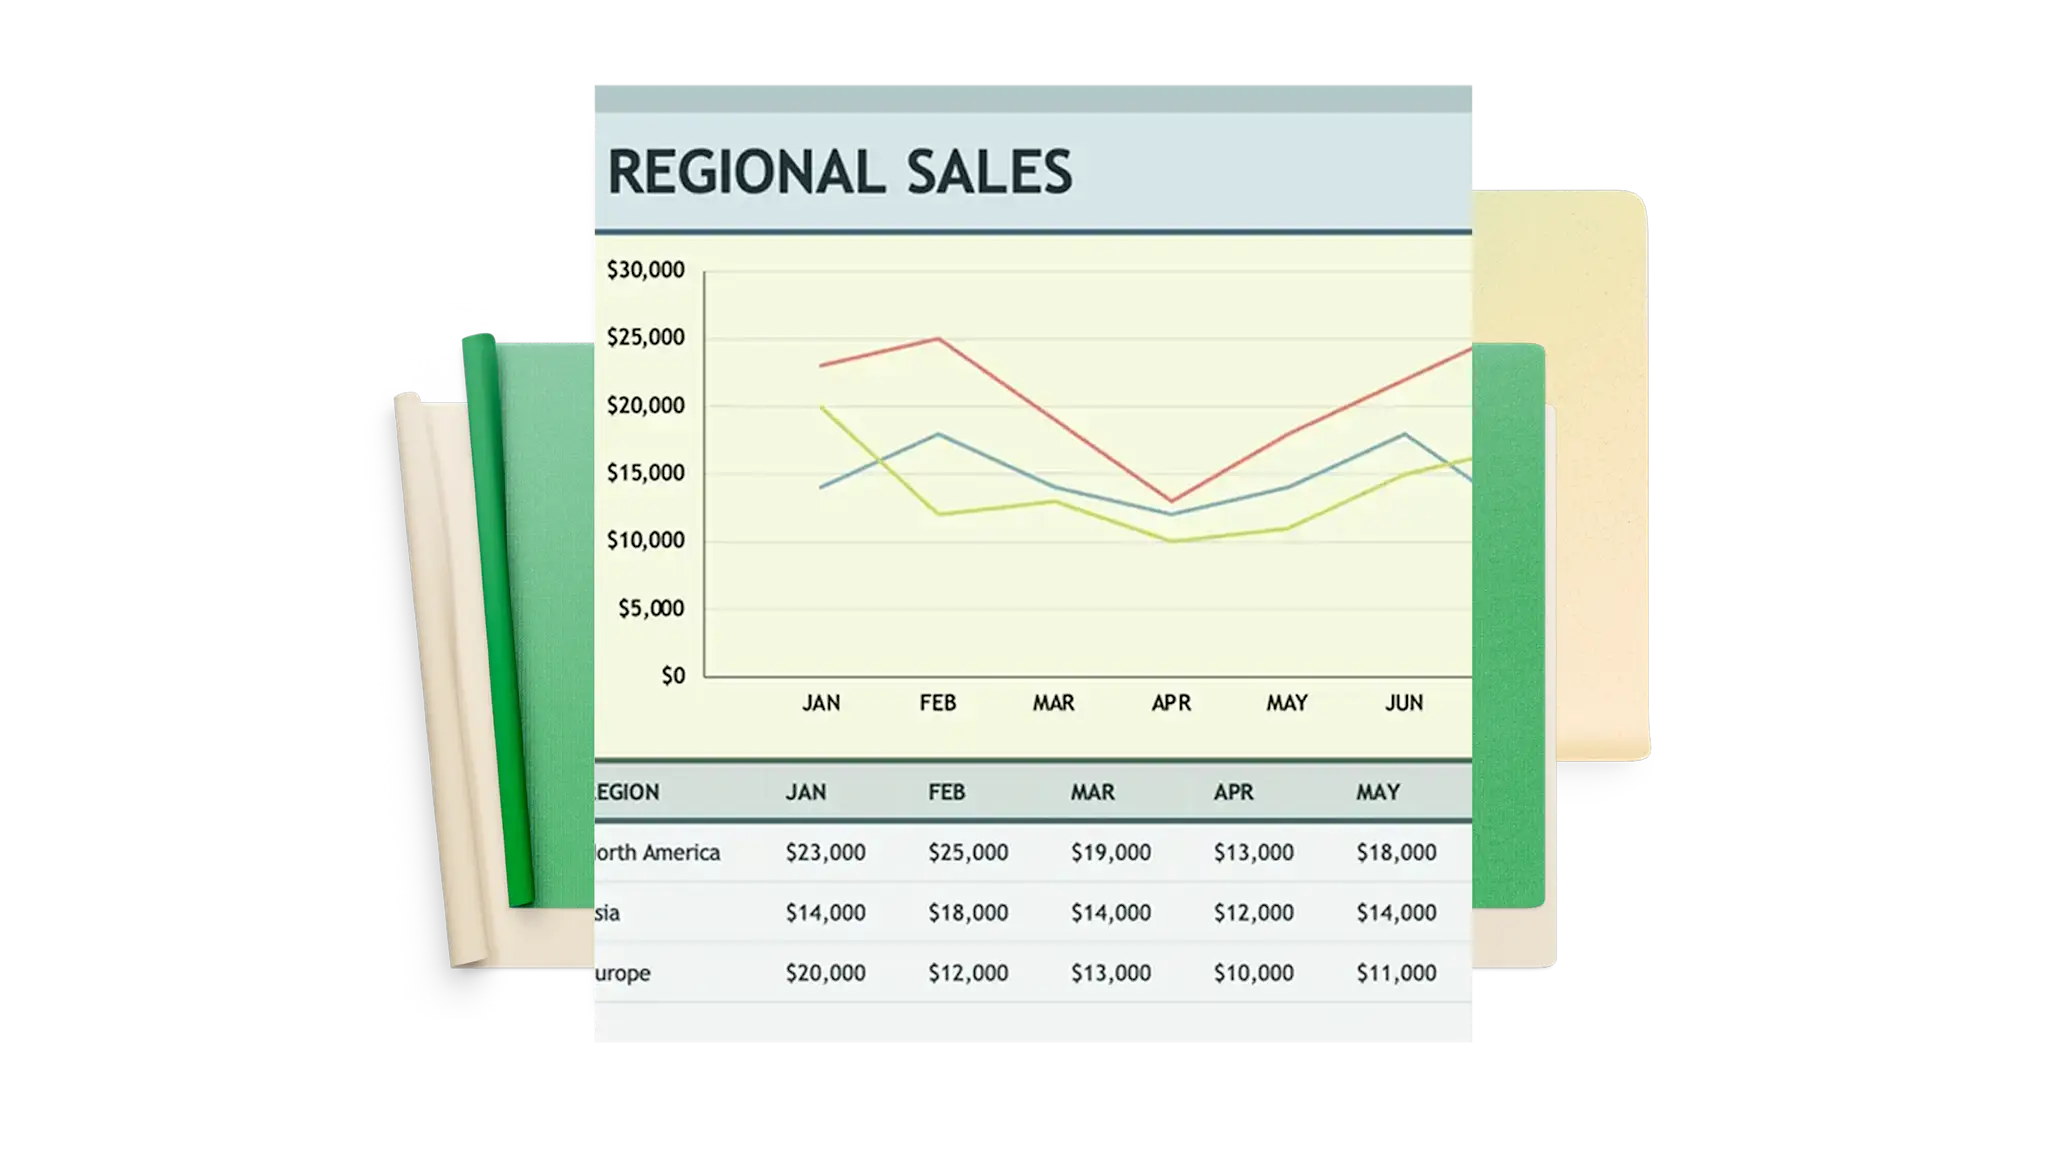
替换附带数据表格的单元格值以自动更新图表
以 PDF 格式保存、打印或共享电子表格
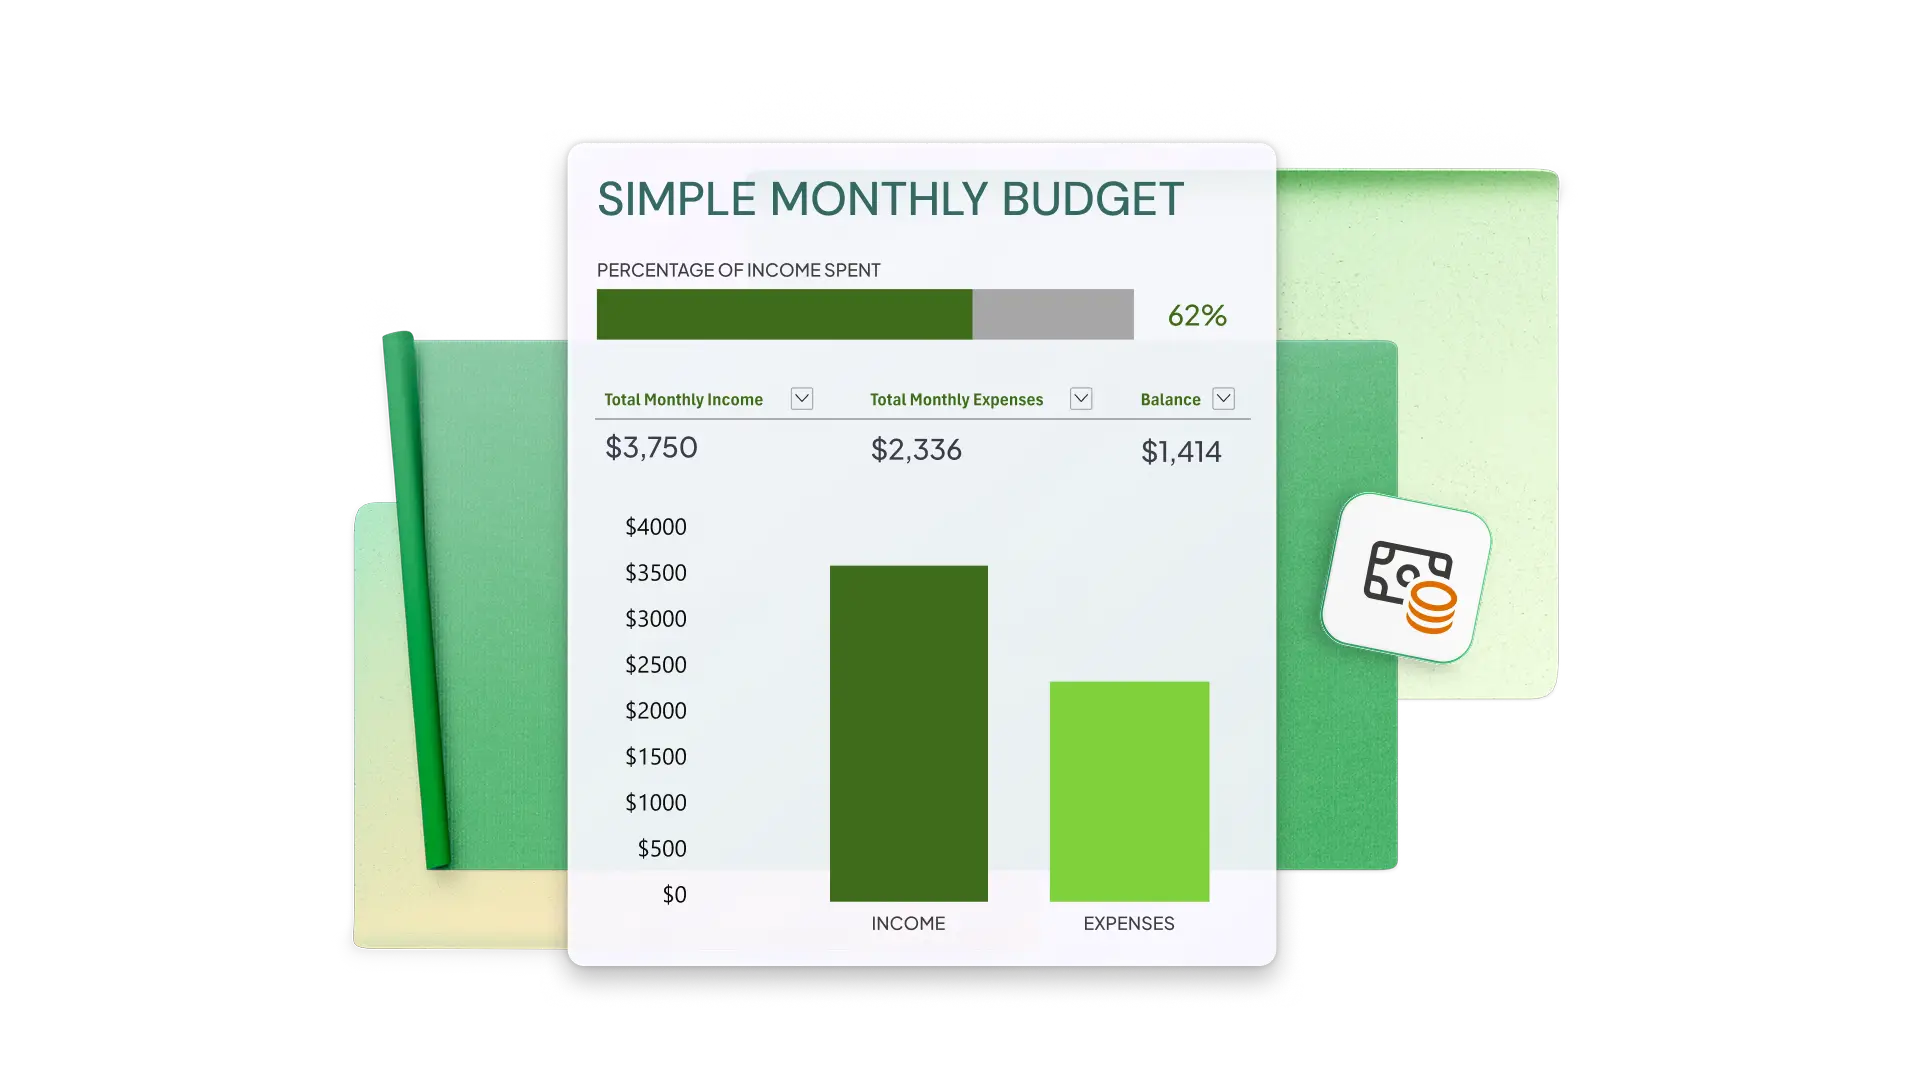
使用可自定义的 Excel 图表模板可视化数据
图表有许多用途: 显示数据、跟踪计划和目标、传递和组织信息。图表也可能有些枯燥乏味。但也可以不是。使用设计师创建的可自定义模板开始所有图表制作工作。图表在演示文稿中并不少见;各种规模的企业通常都需要现成可用的受众友好型图表。可在简历、销售材料以及任何需要整理高层数据的地方试用这些图表。