Excel 用グラフ テンプレート
これらの Excel グラフ テンプレートを使用して、データを共有し、ビジュアルを次のレベルに引き上げる、興味深く、新しい方法を見つけましょう。
グラフ テンプレート
カスタマイズ可能なグラフ テンプレートを参照して、レポート、プレゼンテーション、計画のための明確で説得力のあるビジュアルにデータを簡単に変換できます。

Microsoft Excel でグラフ テンプレートを使用する方法
ご使用のブラウザーで、Excel のグラフ テンプレートを探します
使用するグラフ テンプレートをダブルクリックします
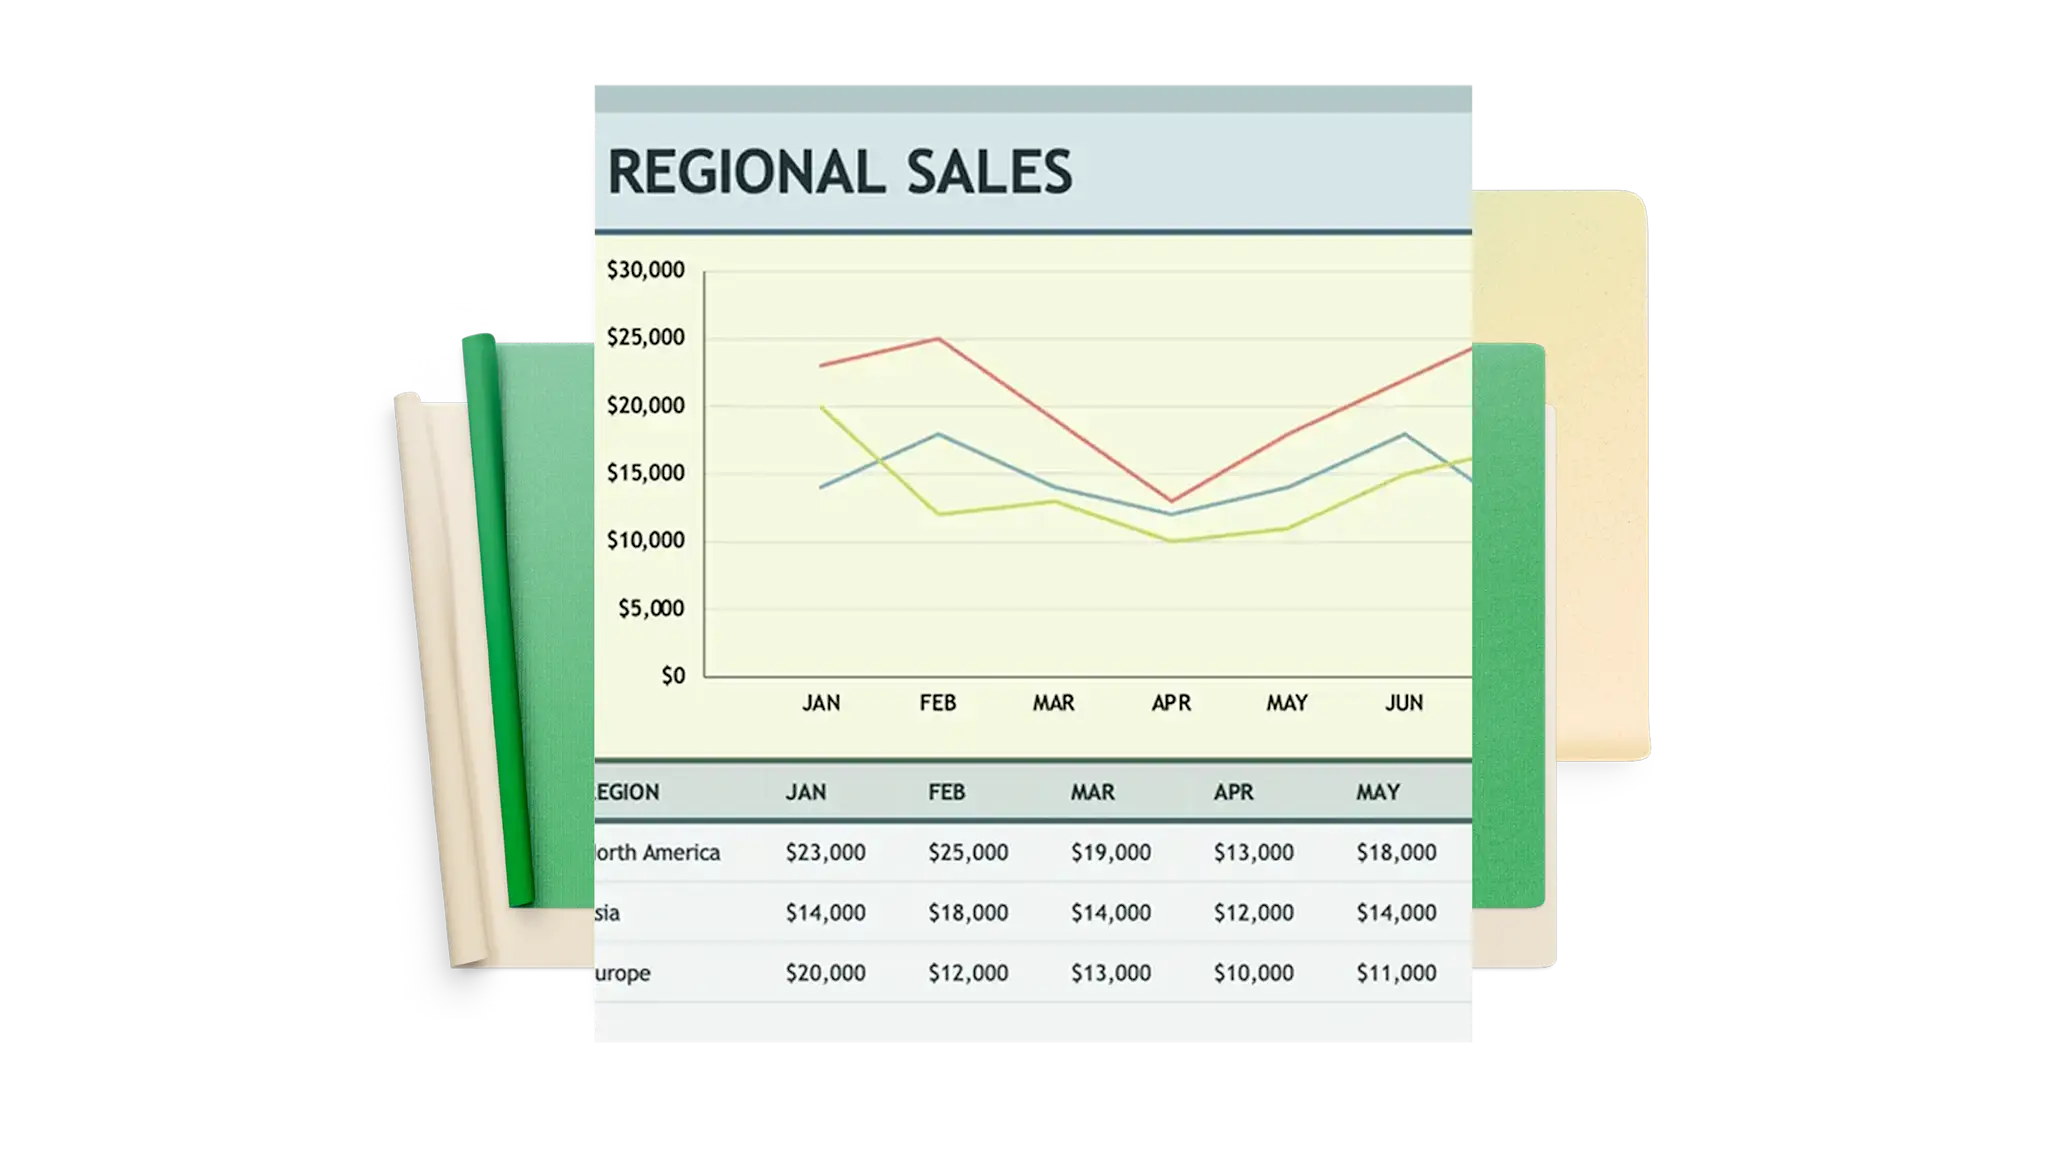
付属のデータ テーブルのセル値を置き換えて、グラフを自動的に更新します
スプレッドシートを保存、印刷、または PDF として共有します
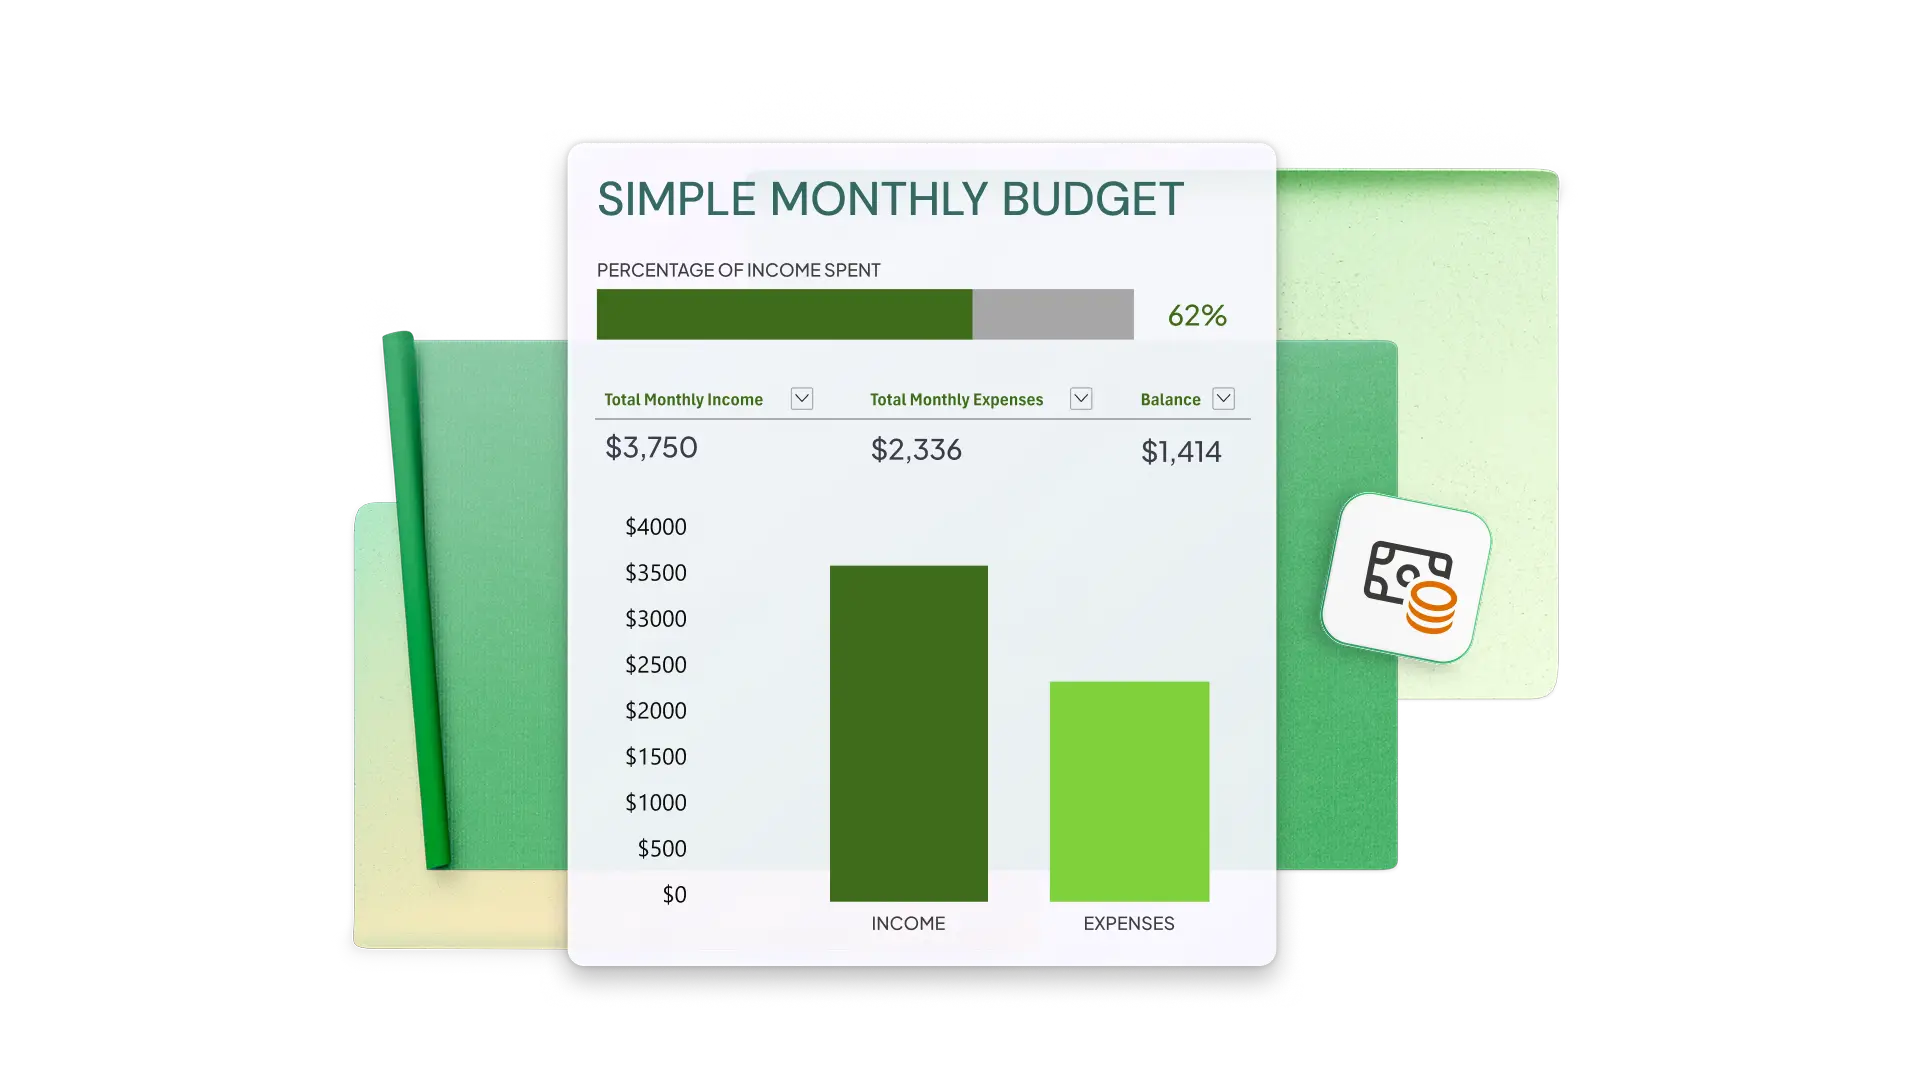
カスタマイズ可能な Excel グラフ テンプレートを使用してデータを視覚化する
グラフには多くの目的があります: データを表示したり、計画や目標を追跡したり、情報を整理したりします。グラフもまた少々退屈なものになることがあります。ただし、それは必須ではありません。デザイナーが作成したカスタマイズ可能なテンプレートを使用して、すべてのグラフ プロットを開始します。プレゼンテーションにおいて、グラフは決して珍しいものではありません。あらゆる規模の企業において、オーディエンス向けのグラフが必要となる場面は頻繁にあります。履歴書、販売資料、その他の高度なデータを整理する必要がある場所でそれらを試してみてください。