Prosty wykres Gantta
Użyj tego szablonu

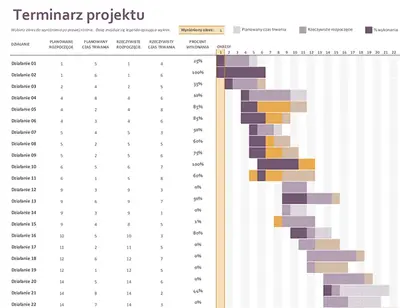
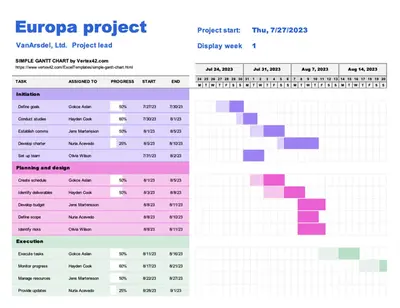
Wizualizuj projekt, aby planować terminy lub zależności, korzystając z bezpłatnych internetowych szablonów wykresu Gantta w Microsoft Excel.

Korzystaj z bezpłatnych szablonów wykresu Gantta w Excelu, aby wizualizować postęp zadań w czasie. Dostosuj gotowe wykresy za pomocą kategorii zadań, poziomów ryzyka, postępu, dat rozpoczęcia i innych danych. Stwórz centralne miejsce do komunikowania interesariuszom stanu projektu.
Start with template examples that automatically create horizontal bars based on your tasks. Customize parameters like planned start, actual start, duration, category, assignee, and progress.
Track a sequence of critical tasks along with floating activities across a timeline. See on-track or at-risk status with bar colors. View your progress with completion percentages and a column highlighting the current day or period.
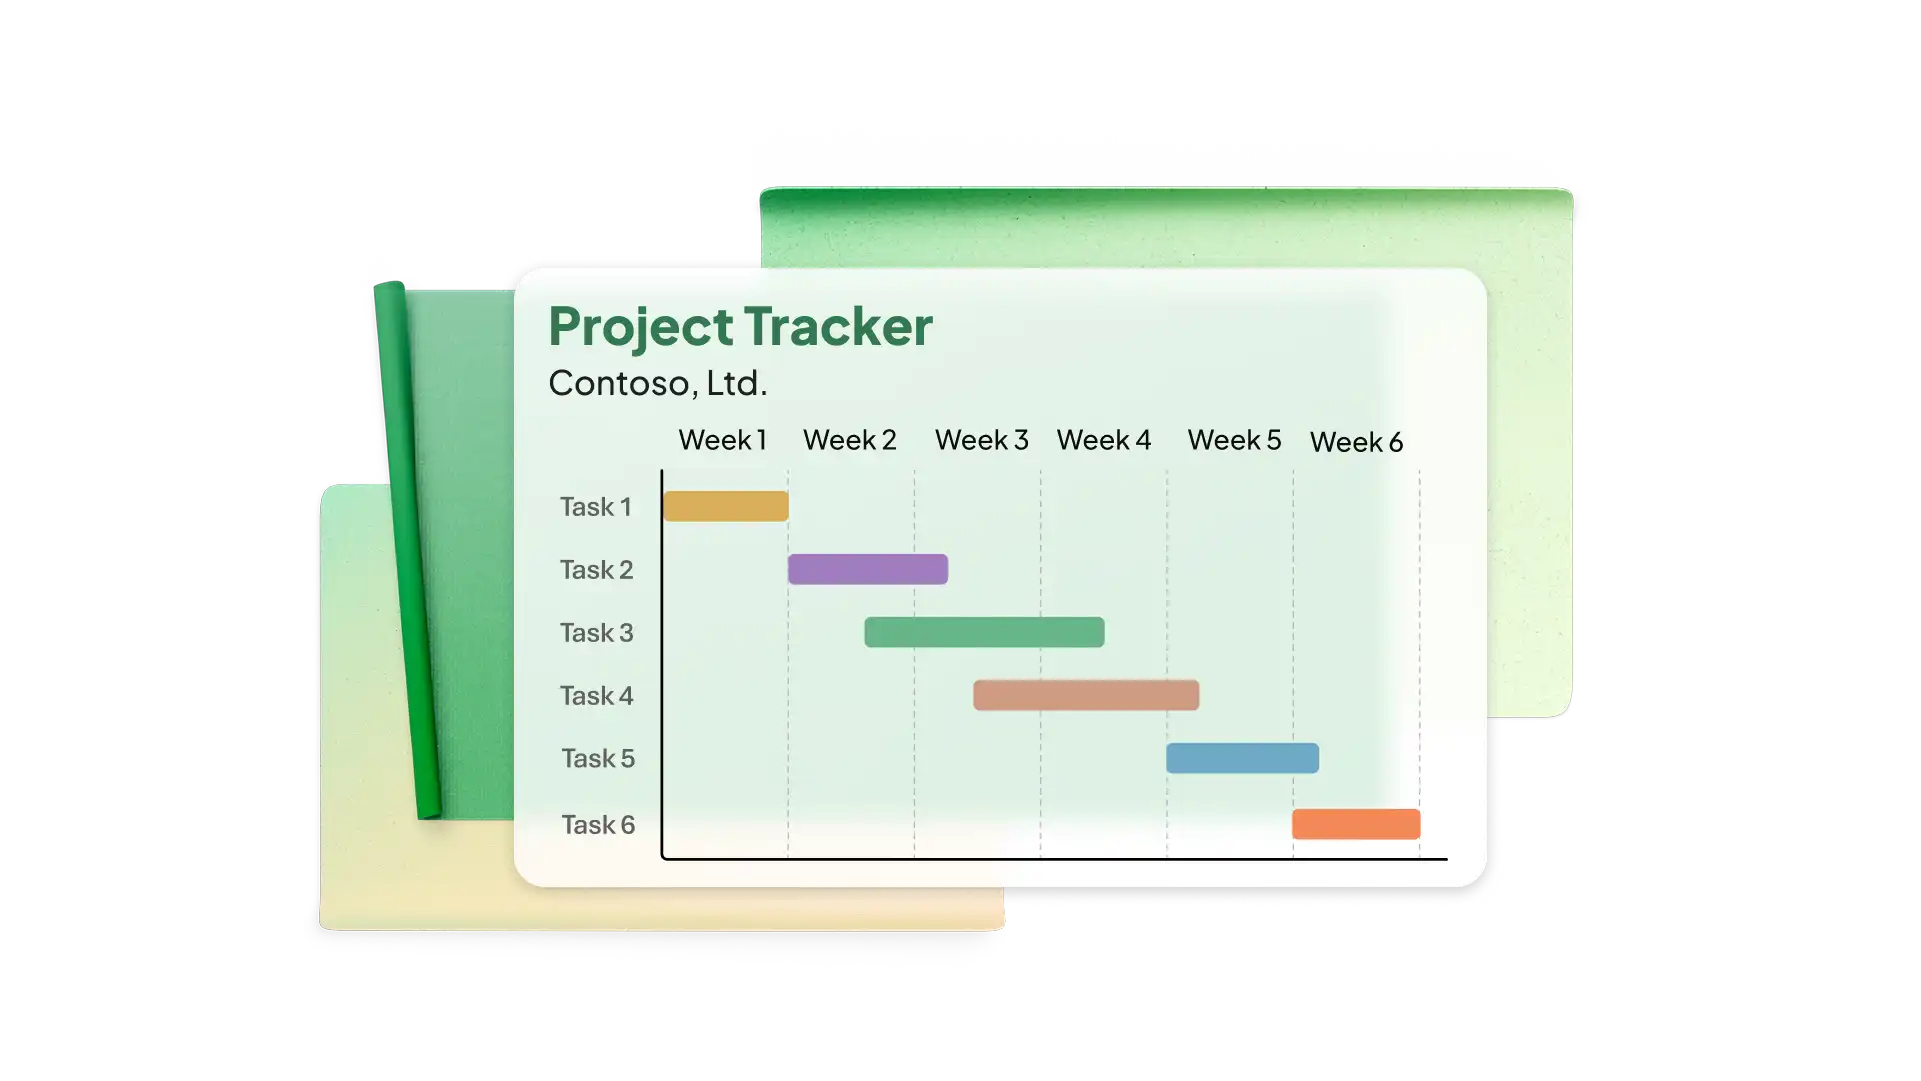

Assign resources like team members, equipment, and materials to tasks. See where certain resources might overlap, and modify the schedule to avoid bottlenecks or unused resources.
Use a Gantt chart in Excel to easily communicate milestone completion to stakeholders like executives, clients, and sponsors. Show the sequence of actions your team is taking to execute the plan on time.

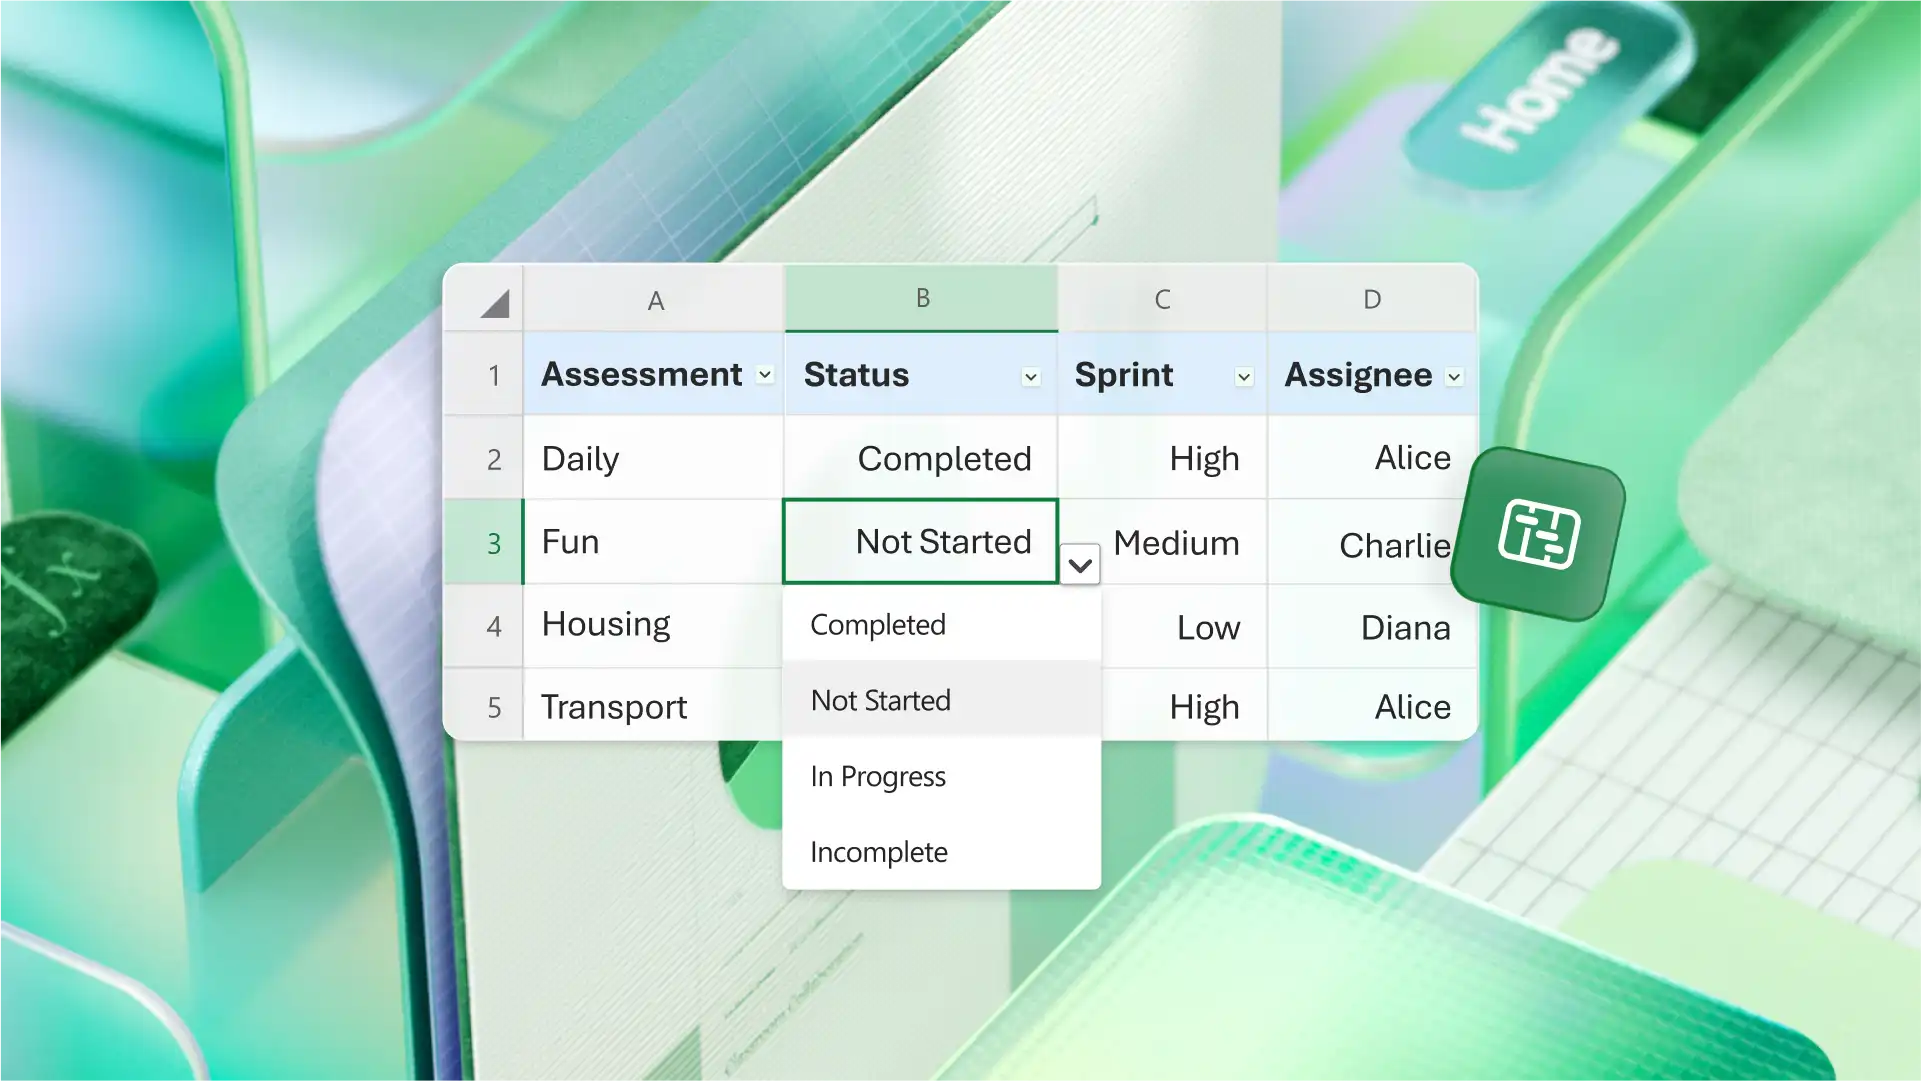
Use Excel functions like conditional formatting to highlight dependent tasks and dropdown lists for assignee and status. Easily transform data from a project plan in Excel to create your Gantt chart spreadsheet.
Chat z funkcją Microsoft Copilot w programie Excel, aby rozszerzyć kolumny osi czasu lub utworzyć kolumnę dla zależności między zadaniami. Poproś funkcję Copilot, aby dostosowała skalę czasu do projektu i wygenerowała wykres Gantta na podstawie tabeli z zadaniami.
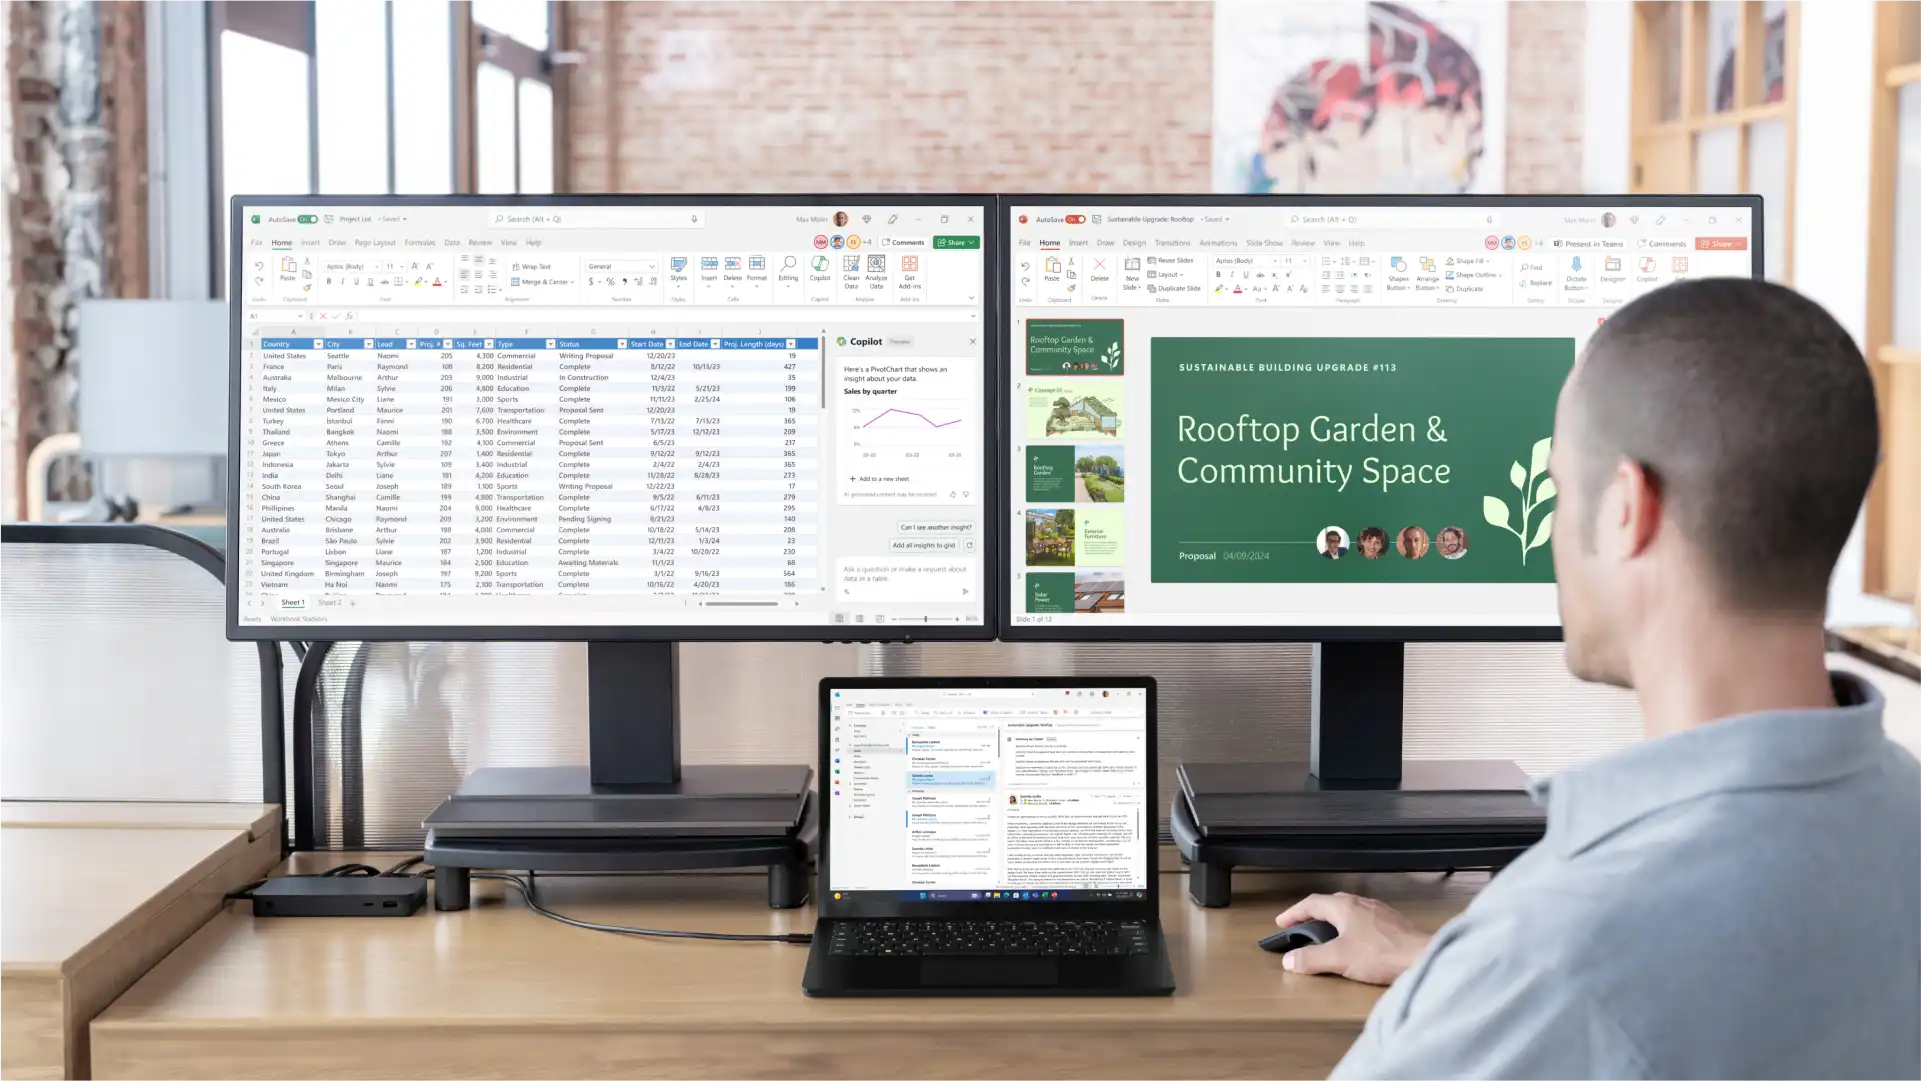
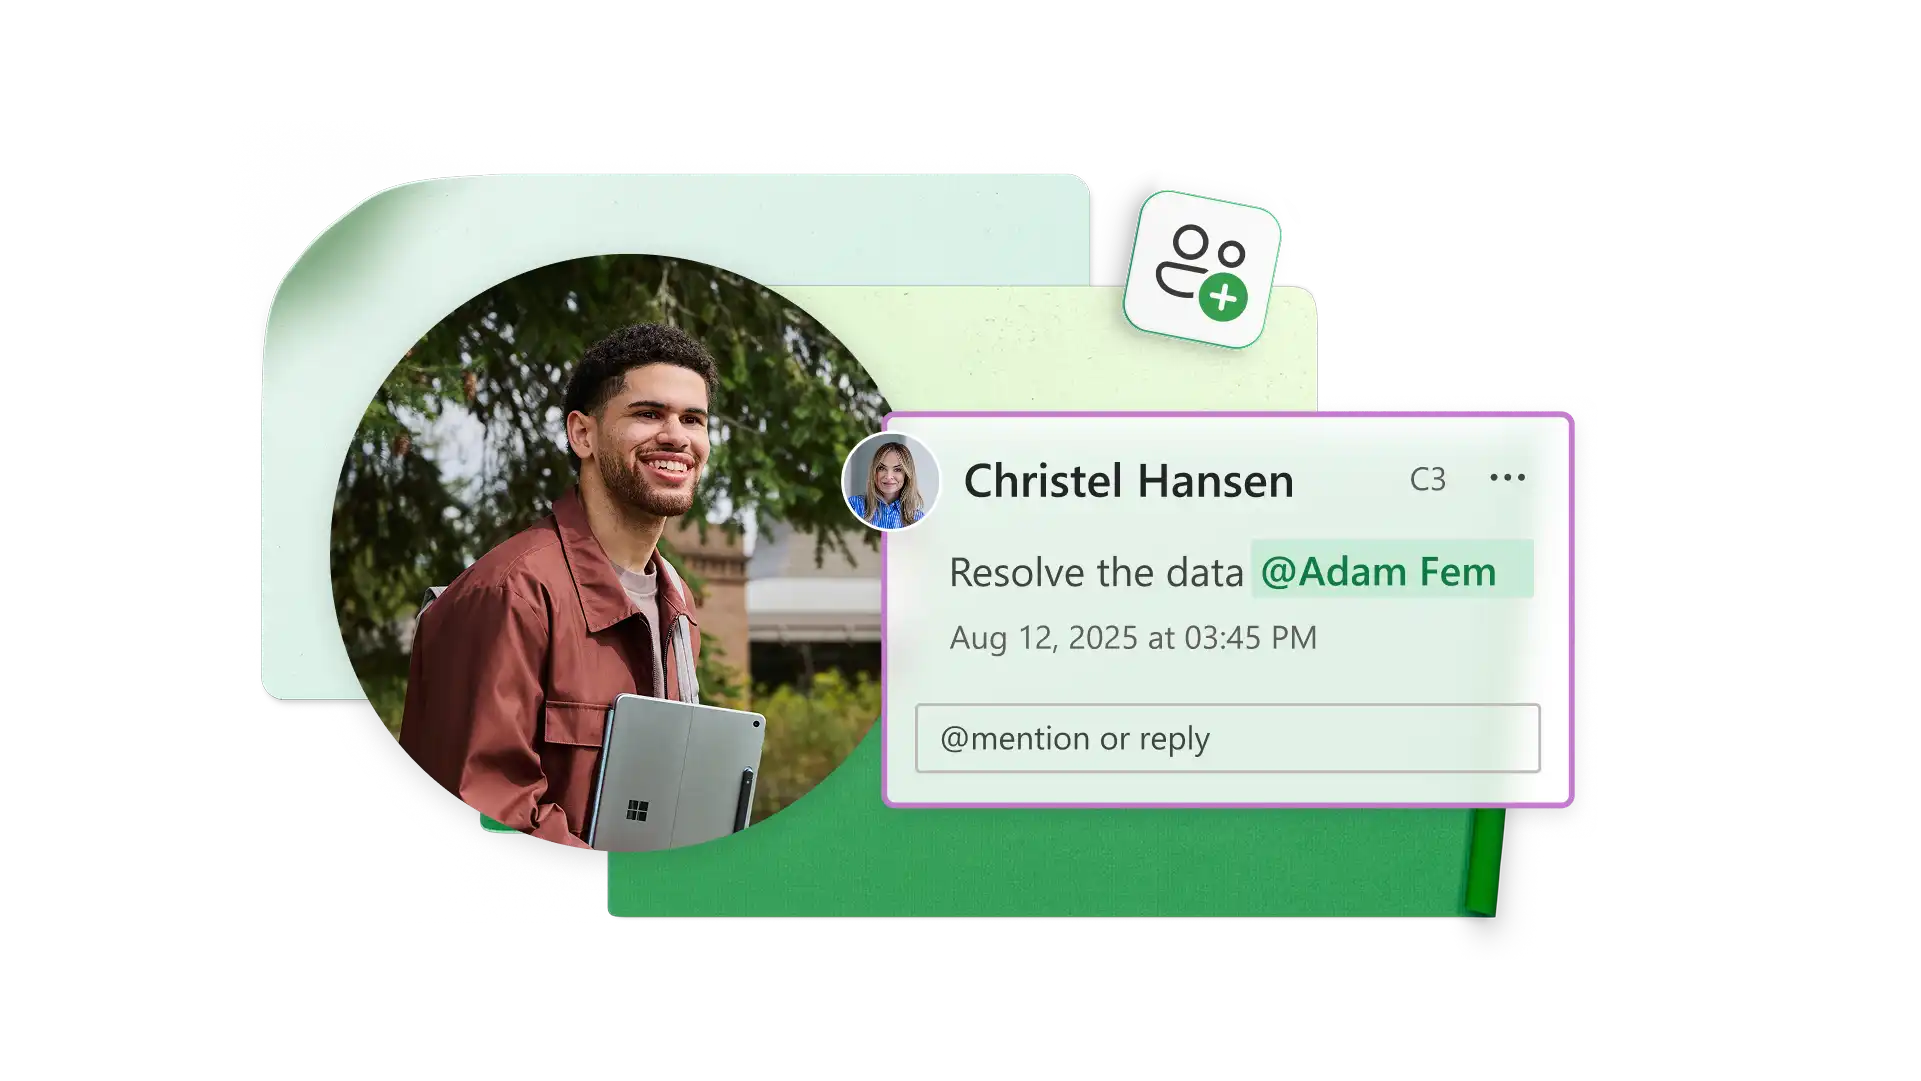
Use comments and tags to collaborate with team members in Excel online. Create sharing links for easy syndication and specify access and editing permissions for selected users. Set expiration dates for sharing links over a specific timeframe to control access to sensitive information.
Project managers: visualize tasks and resources across a timeline.
Construction managers: create construction schedules to manage phases and subcontractors.
Event planners: schedule logistics and vendor activity leading up to an event.
Software teams: plan development milestones and feature rollouts.
Consultants: track client deliverables to meet deadlines.
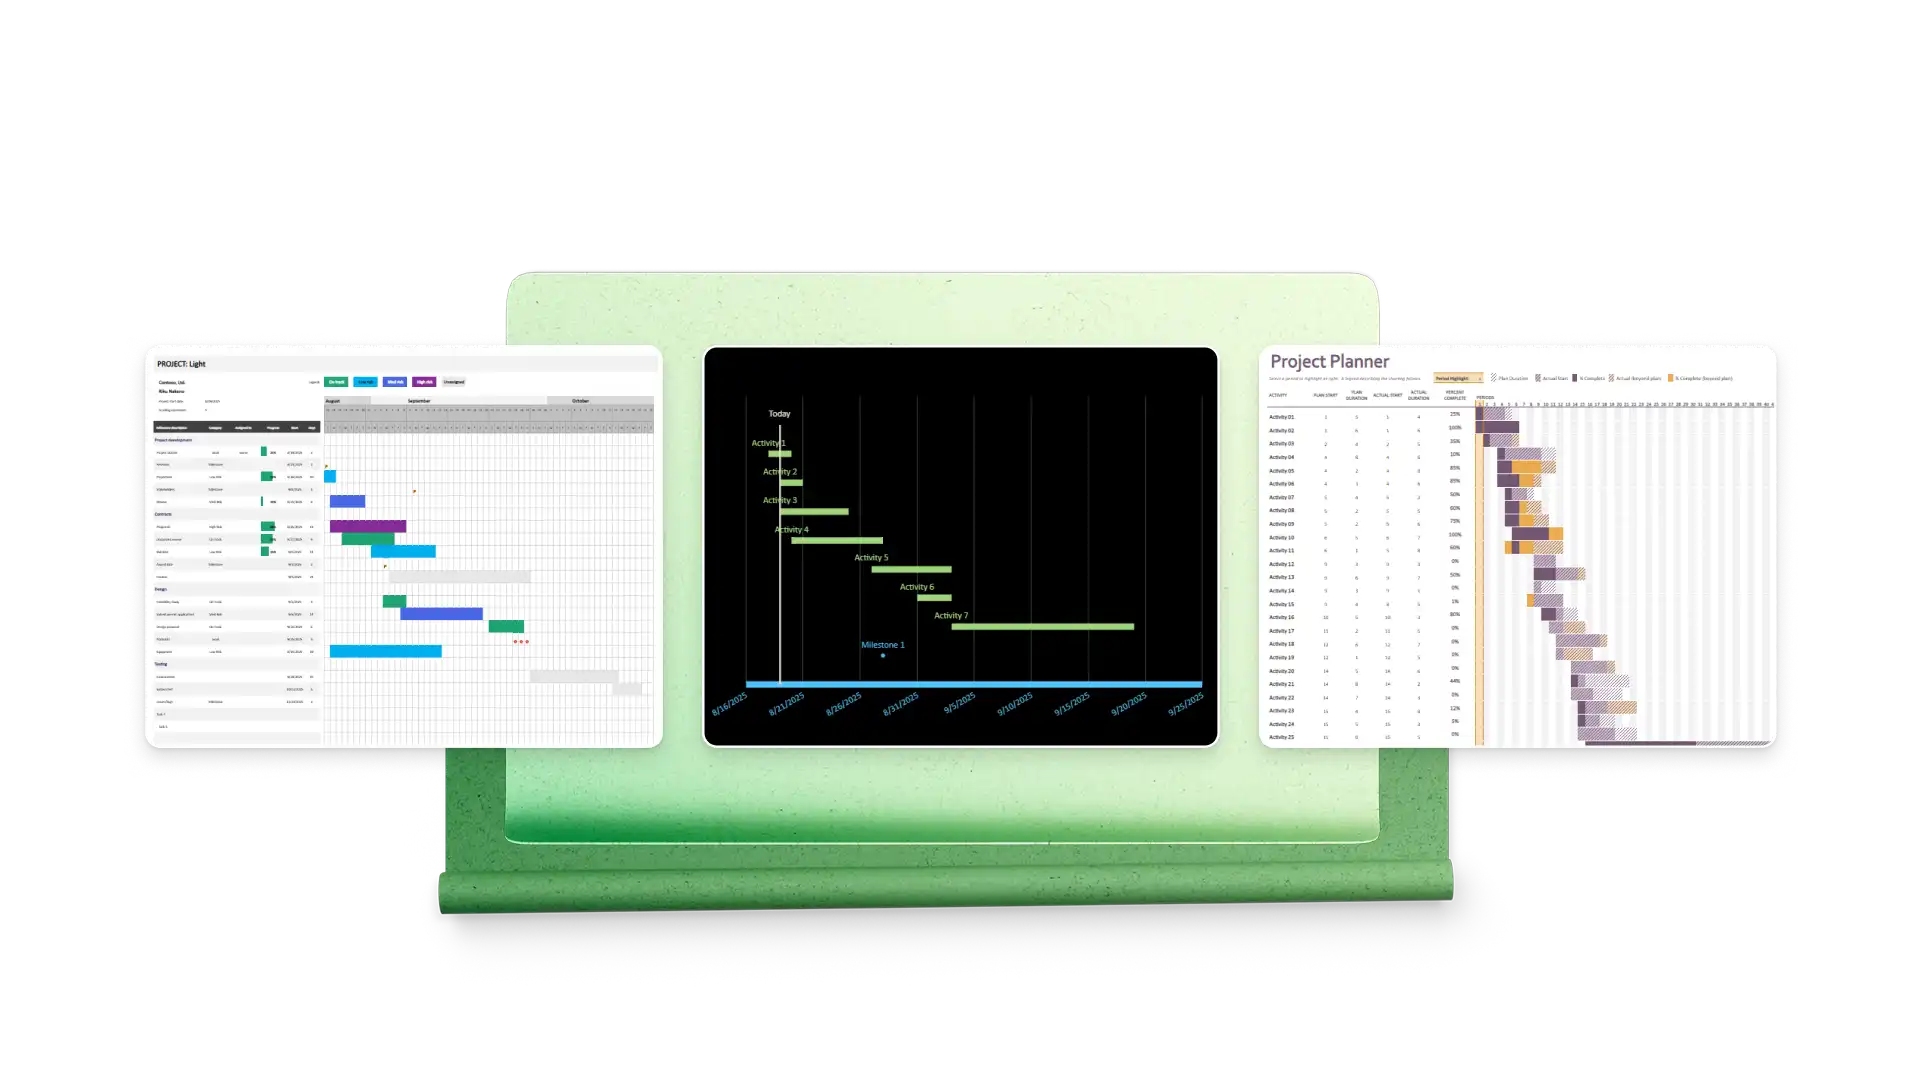
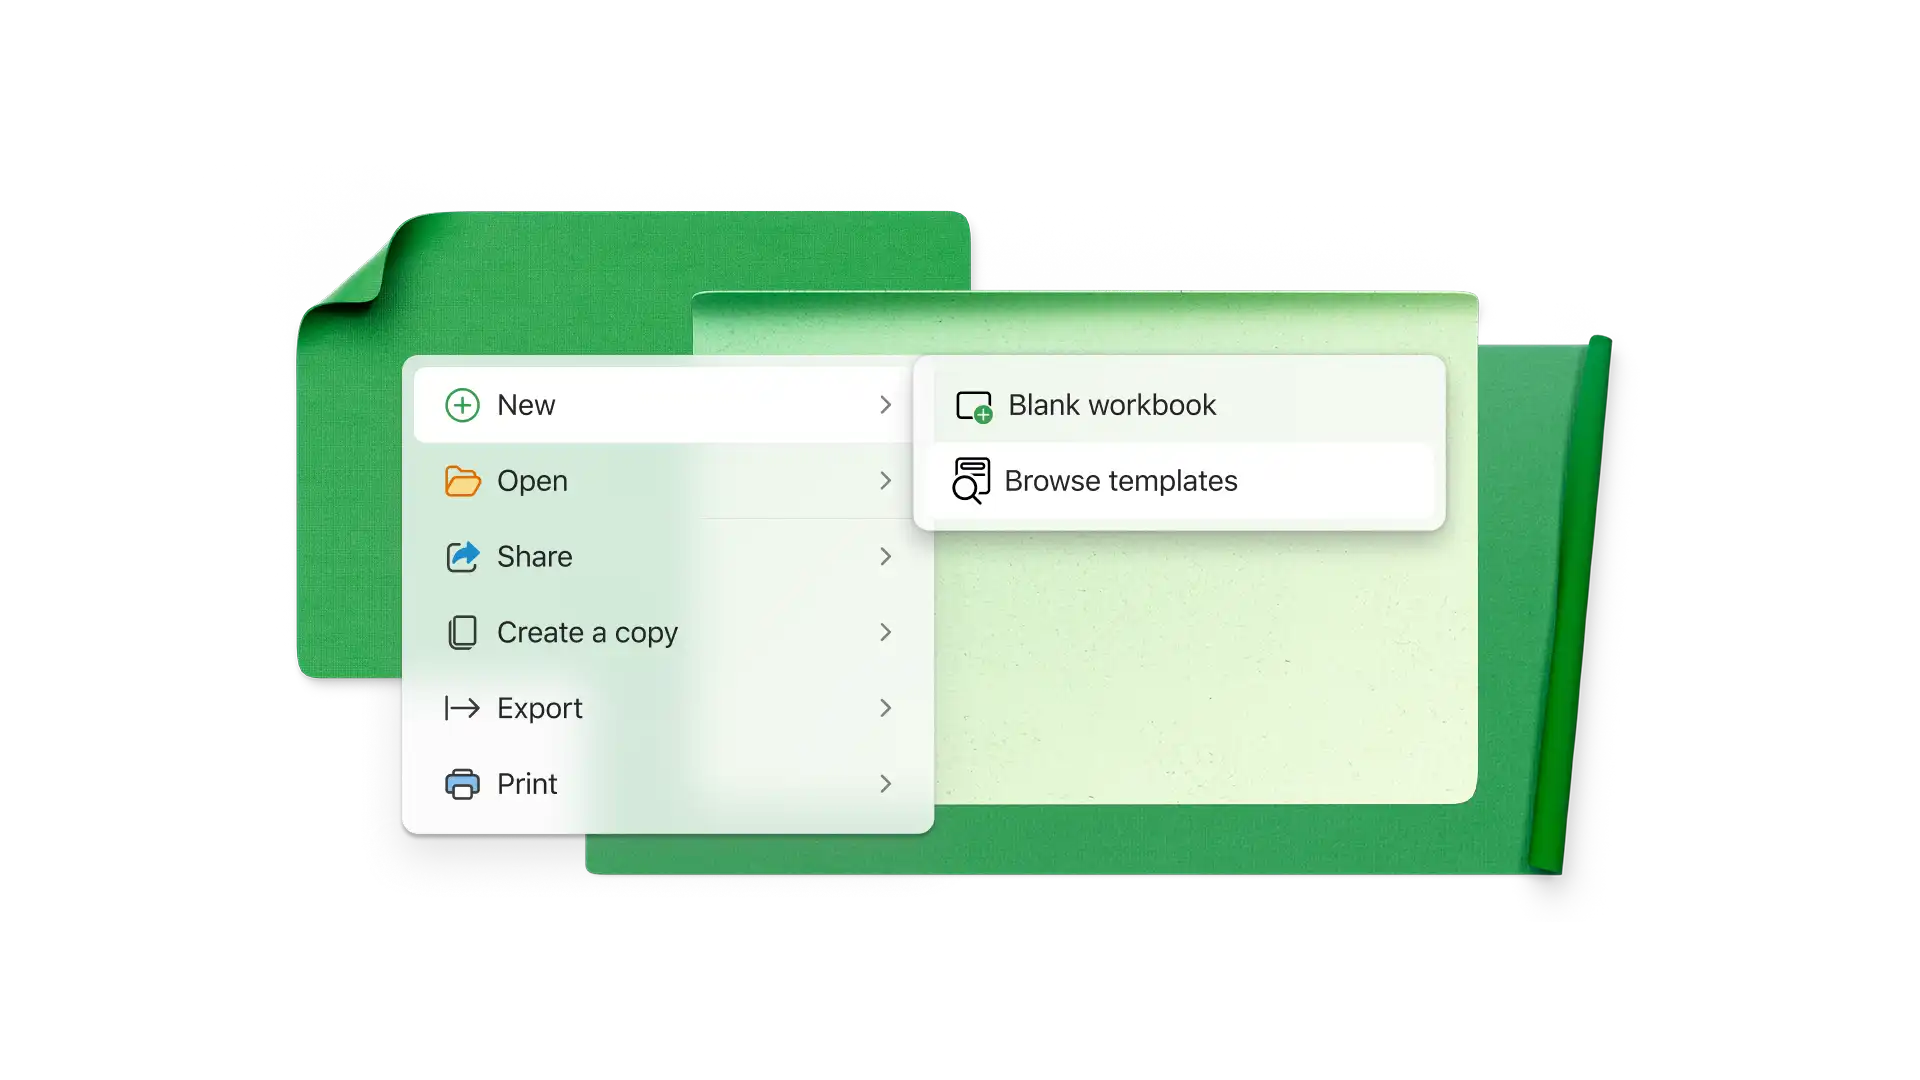
Start with a Gantt chart template or use Copilot to build a data table and stacked bar chart
Verify the time scale matches your needs or modify it
Add the name, starting date, duration, and status of each task in the data table
See stacked bars automatically reflect your data
Record actual task durations and statuses during your project
A Gantt chart is a diagram for visualizing a project schedule. Gantt charts use horizontal bars to track task duration and completion across a timeline. They're best used after you’ve planned your project with a work breakdown structure or other planning method.
Gantt charts let project managers track activities, resources, dependencies, and planned and actual duration to execute a project schedule. You can also see the progress your team has made up to a point in time so you can communicate project status to stakeholders.
Gantt and PERT (Program Evaluation and Review Technique) charts are both ways to map out a project schedule. PERT network diagrams are ideal for finding the critical path and total project time, while Gantt bar charts are best for tracking task progress during execution.
Gantt chart templates in Excel include timescales for days and weeks that also show months. If you want each column to represent a month, simply edit the scale to show months. You can also ask Copilot to change the timeline from days to months.
Start with a Gantt chart template in Excel and add your dependent tasks with start and end dates. You can highlight task names that are dependent on others with conditional formatting. You can also insert arrows manually to show dependent tasks.