
Simplify analysis for large datasets and find totals and patterns faster with the right spreadsheet tools. Summary tables, also known as PivotTables in Microsoft Excel, are a practical way to turn detailed data into organized summaries, so they’re easier to review.
Creating summary tables from scratch is a manual, detailed process, but Copilot in Excel helps make it easier by reducing steps, for both beginners and experienced users. Generate a ready-to-review table using AI to find a quick starting point for analysis, with just a few simple instructions and minimal effort. Read on to learn how summary tables work, easy steps to create them in Microsoft Excel, and Copilot tips to get started.
How do summary tables work in Excel
Summary tables condense datasets to highlight the most useful information, while a PivotTable is the Excel tool that creates these types of tables. The tool groups rows of values and presents totals, counts, and averages in an easy-to-read format, using a simple workflow.
Group data: Excel splits and organizes information into relevant categories, such as defined time periods, regions, average spends, or sales.
Calculate values: Excel then performs calculations using SUM, COUNT, or AVERAGE, to calculate values for each group or as per the task.
Display summary: the result is a concise table that is easier to scan than the original data.
This process works best for tasks that involve cleaning up and categorizing large volumes of information to compare groups for smooth decision-making. If a revenue spreadsheet lists sales by region, a summary table can show values for each region side by side, making it easy to spot local trends and decide where to focus next.
With Copilot, creating summary tables can change from being a lengthy workflow into an easy one. Copilot can also provide a brief analysis of emerging patterns and insights from the table to help with strategic planning.
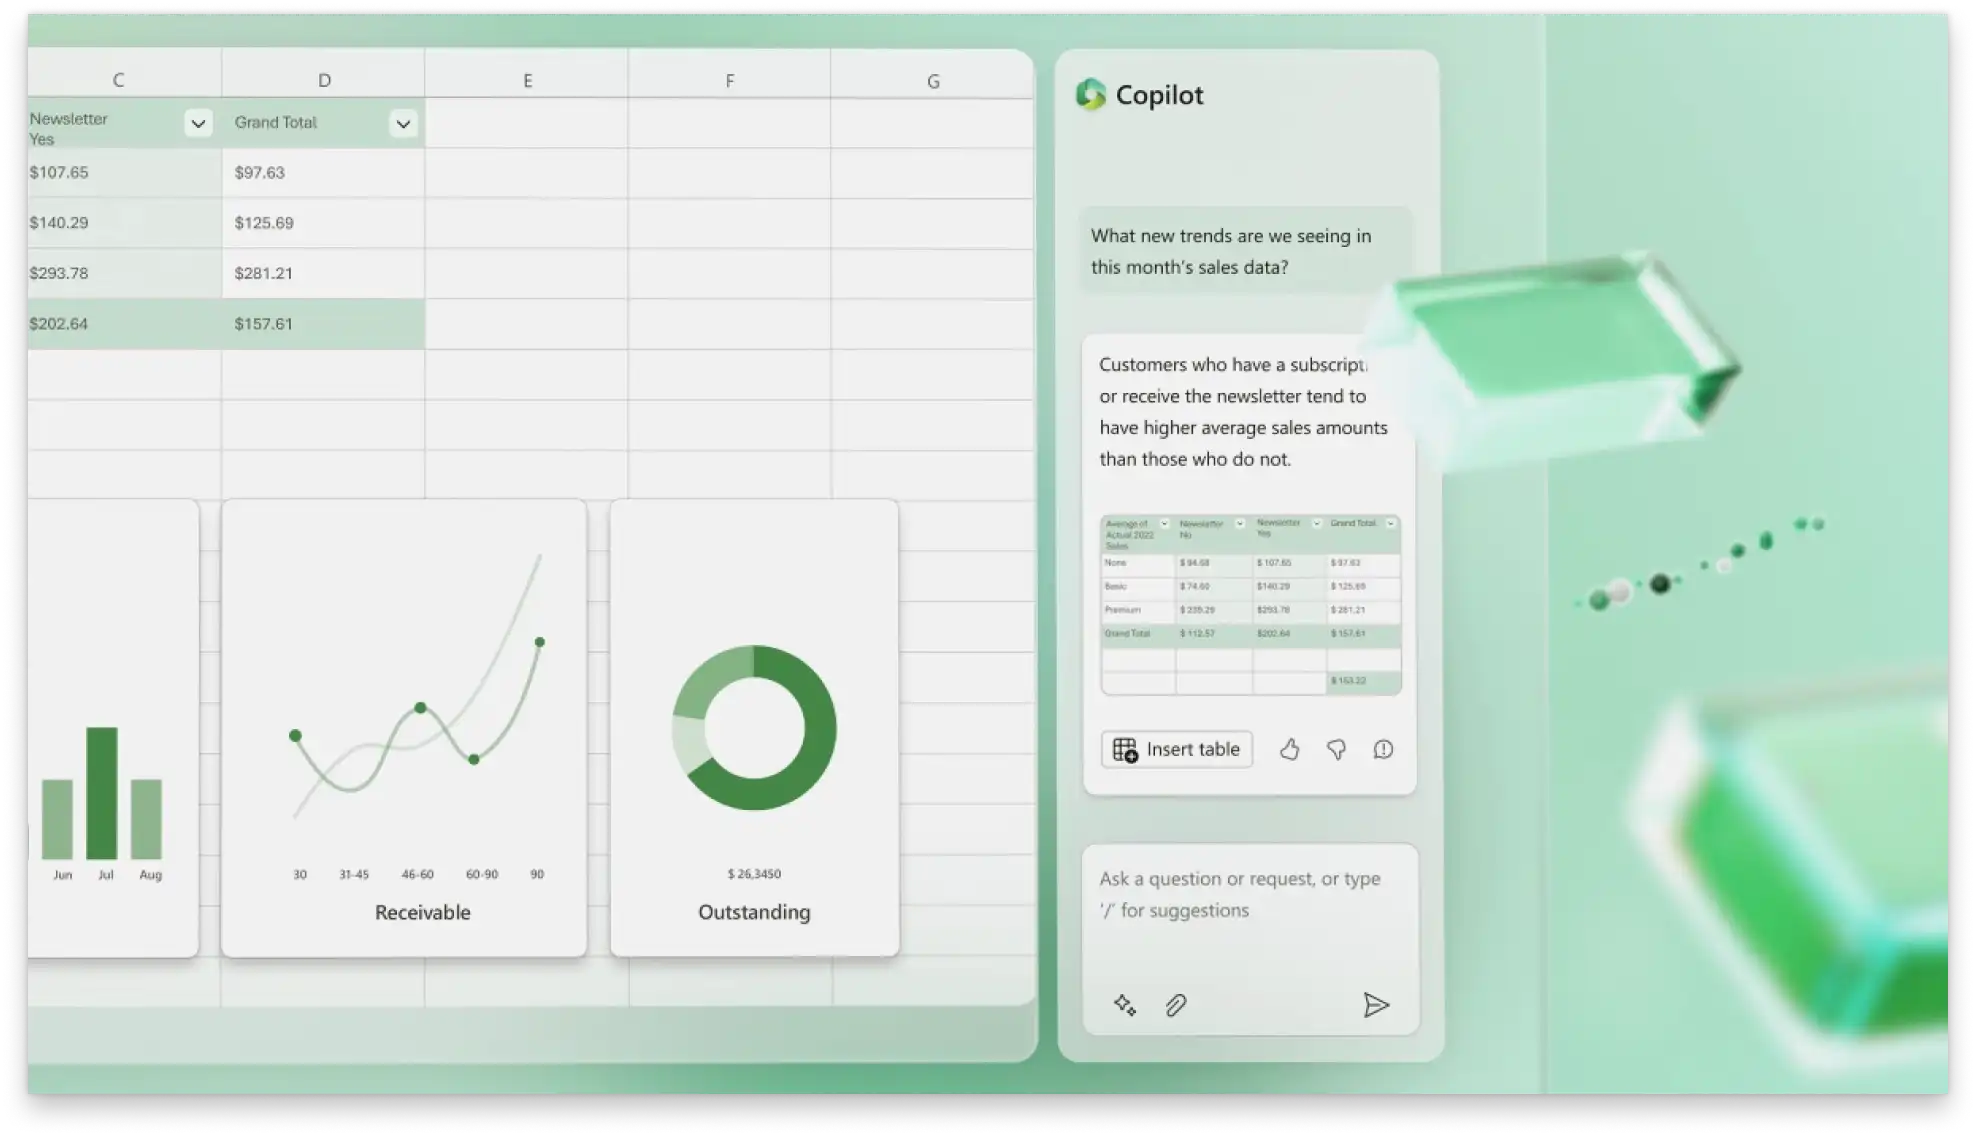
How to create PivotTables in Excel with AI
Upload or open a spreadsheet in Excel for the web.
Organize the dataset into rows and columns with clear headers, and check that no rows or columns are blank.
Locate the Copilot in Excel icon to initiate a chat. Explain the task and required summaries using simple phrases.
Review the suggested summary table that Copilot creates. Check if data is grouped correctly, for example, by region or month, and that suggested calculations like total or averages match the task.
Once the table is ready, Excel may place the table in a new or existing sheet.
Adjust the table if needed by changing fields, updating calculations (for example, sum to average), or applying filters and sorting.
Ask follow-up prompts in Copilot to refine the table or to explain more insights.
Save and share the summary for review using a secure online link, or export as a PDF to send via email.
Tip: refresh the PivotTable when the source data changes to keep the summary up to date.
Try these Copilot in Excel prompts to get started
Calculate revenue in sales
Compare budgets with spending
Review business expenses
Summary tables bring structure to data and reduce the need for manual setups by grouping rows and showing key values in one place. Using a few simple prompts in a Copilot chat, finalize data and make progress on action points.
Explore more ways Copilot in Excel can help with the process of analyzing spreadsheets, fix Excel errors, and optimize everyday tasks with the online formula generator in Microsoft Excel.
Frequently asked questions
- How to use AI in Excel?
Enable Copilot in Excel for the web or Excel desktop app to start chatting with the AI spreadsheet assistant. Use simple descriptions to explain a task, including creating PivotTables or applying calculations, and Copilot will create a draft within the workbook. AI will also show the process, assumptions, and formulas along the way.
Editing with Copilot in Excel requires either a Microsoft 365 Personal or Family subscription (with an AI credits plan), a Microsoft 365 Premium subscription, or a commercial Microsoft 365 Copilot subscription.
- Can an AI summary table be edited after it is created?
Make changes directly in a table when source data changes or to correct any values, and formulas may update instantly. After the table appears, adjust fields, calculations, filters, and sorting options accordingly in the spreadsheet.
- How to refresh a PivotTable?
To refresh a PivotTable, click anywhere inside the table and select the Refresh button from the PivotTable toolbar or right-click menu. This is an easy way to see changes in values reflected in a summary table.
- What type of data is needed to create a summary table?
A summary table requires structured data in a table format. Make sure to organize data in rows and columns. Each column should have a clear heading, while each row should represent one record or entry. Avoid completely blank rows or columns and merged cells to create an accurate summary table.
- Why is the PivotTable not showing the expected results?
It is common to receive unexpected results, especially when building PivotTables for the first time. Review data again to see if it’s grouped correctly, and that all headers are clear and properly filled in. Data formatting errors like missing or unclear headers can often cause interruptions. Double check blank rows, duplicate categories, or inconsistent labels and then try generating the summary table a second time.