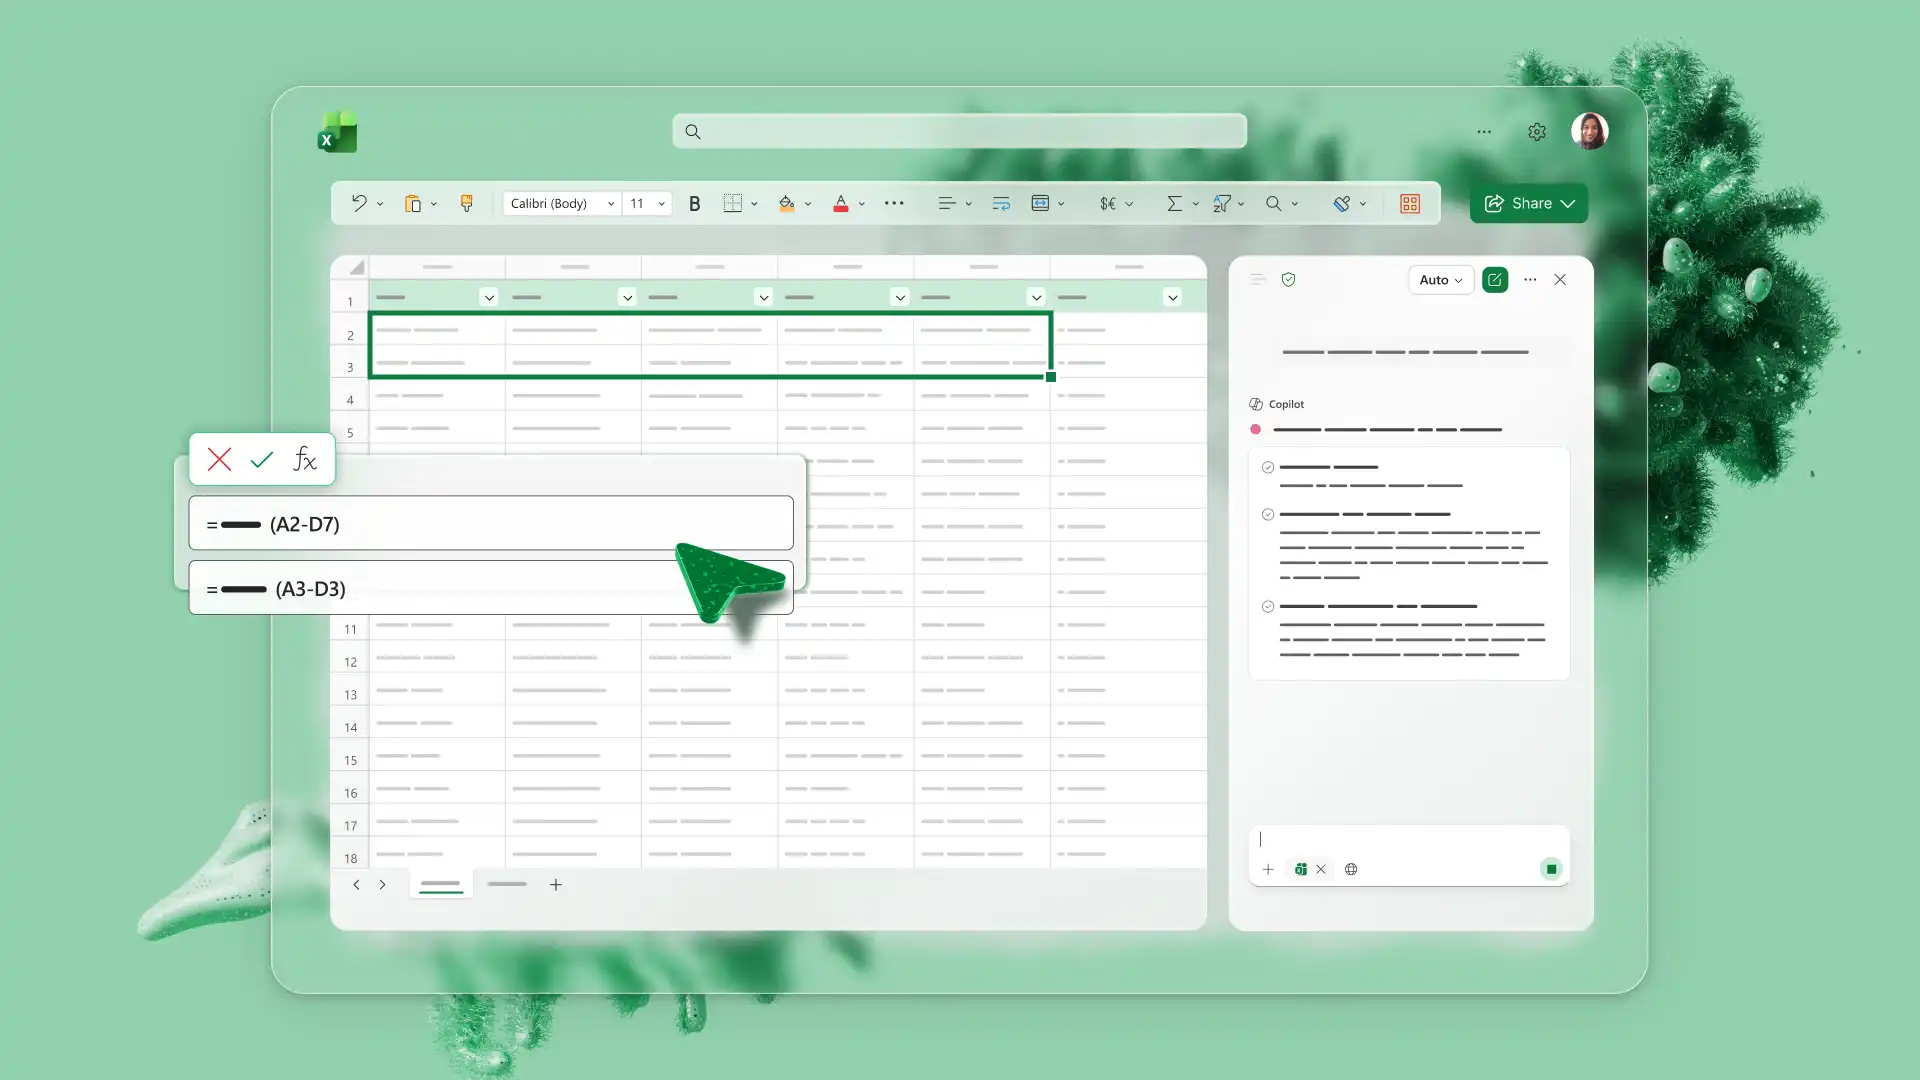
Turn spreadsheet data into actionable insights with AI in Microsoft Excel. Copilot in Excel can help create worksheets, organize information, suggest formulas, and analyze data, reducing the manual steps in everyday spreadsheet work.
Across budgets, inventory tracking, invoice generation, and business reviews, AI can help identify patterns and explain results. The same requests help improve data quality, and every suggestion stays available to check first. Support with formula troubleshooting and trend spotting makes spreadsheets easier to build, understand, and share.
Explore eight practical examples of how to use AI in Excel for spreadsheet creation and analysis. The list moves from organizing data and generating formulas through to AI spreadsheet analysis that supports better decisions.
1. Ask for the right formula
A plain description of the calculation can help Copilot suggest a formula to review, which means a request to total a column of revenue never needs the function name. Select the range, explain what the result should show, and the assistant offers a few options based on the values in those cells. That helps most in workbooks like inventory lists or expense trackers, where a single inconsistent calculation changes every total below it.
Read the suggestion before applying it and confirm the cell references point where they should. Anyone starting with a blank sheet can describe the calculation to the Excel formula generator instead, then ask for an explanation of the formula it produces.
2. Clean large data sets
AI can help identify and organize cleanup tasks such as duplicate rows, inconsistent capitalization, and ranges that need table formatting. Ask Copilot to correct any of them, or to convert PDF data, which is often all a contact list or event log needs to become useful for analysis.
For larger or unusual cleanup tasks, check the work manually. Look over each change and confirm the values read correctly before any analysis. The spreadsheet maker explains table structure in more depth for anyone building a new sheet. A cleanup request that also asks for a list of affected rows makes that review much faster.
3. Analyze spreadsheet trends
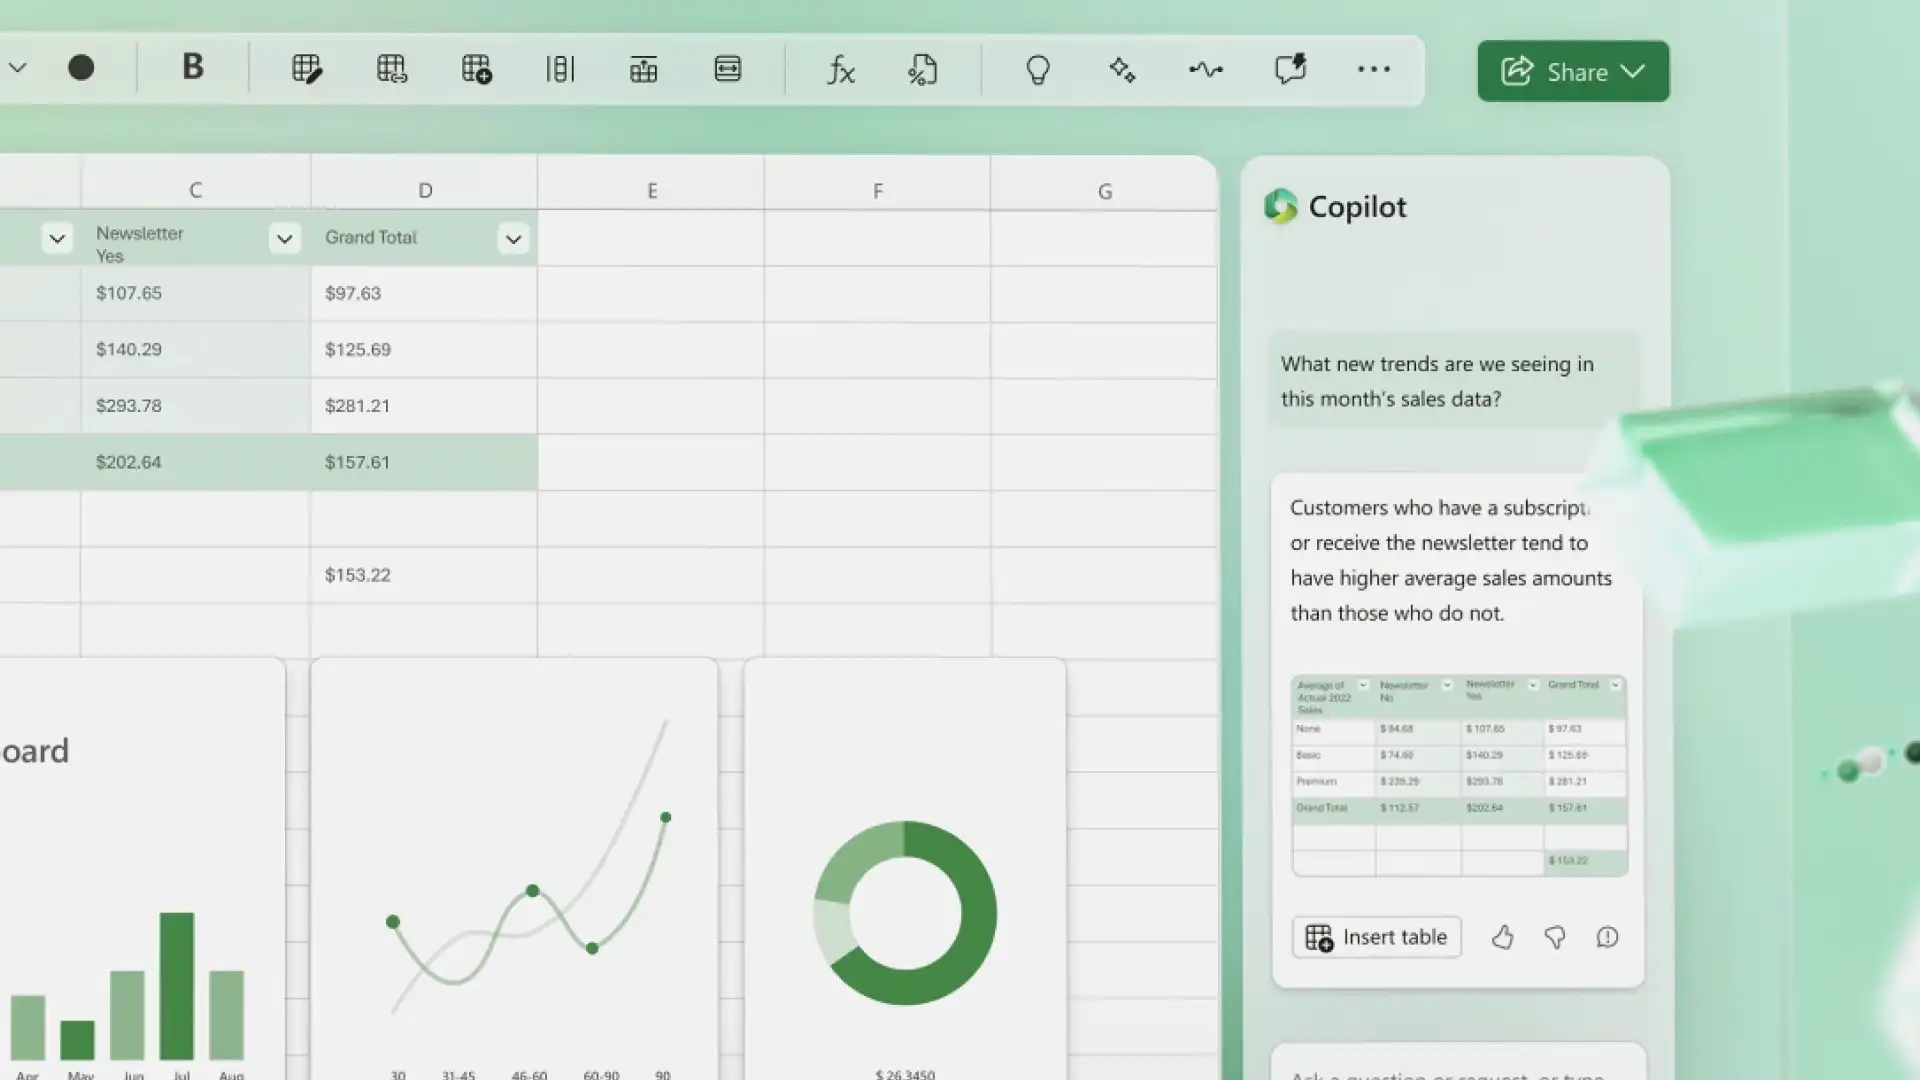
AI spreadsheet analysis begins with a plain question typed into the chat. The response is a short written explanation of what a chart, timeline, or tracker is showing, rather than more figures to work through. Copilot helps compare values, describe movement across a period, and point out results that may need a closer look. Month to month differences in budget expenses, sales, or inventory make a natural first question.
Formulas such as TREND or FORECAST.LINEAR help when a pattern deserves closer attention. Spreadsheet data analysis works best as a conversation rather than a single request, so clarify what a figure means, compare the explanation with the source data, then let it inform a decision. Requesting the unusual results alongside the trend answers both questions in one reply.
4. Visualize data
A request that names the chart format and the data range helps Copilot suggest a visual direction worth checking. Choose a line graph, column graph, scatter plot, or pie chart depending on what the figures need to show, since a vague request tends to return something generic.
Check the data range and the labels, correct anything that reads incorrectly, then add the finished visual to a report alongside survey responses or monthly figures. A chart does the explaining that a column of figures cannot, which is why these visuals are worth checking carefully ahead of a wider release.
5. Summarize data
Summaries pull the key points out of a workbook running hundreds of rows, which makes a large data set easier to review. They suit business budgets, team projects, and sales forecasts, and the same underlying data can produce one version written for executives and another written for students, depending on who needs to read it.
Treat the result as an opening draft rather than a finished report, and compare it with the source data ahead of sharing widely. A summary can miss the context that only shows up in the sheet itself. AI can also create summary tables for anyone who would rather see the numbers arranged than described, and asking for plain language keeps the result easy to compare against the original figures.
6. Analyze spreadsheet error codes
#NAME?, #REF!, and #VALUE! can point to formula, reference, or data issues that need a closer look, and pasting the full formula into the chat may return the likely cause in plain language along with what to check next. Describing the problem in everyday words works just as well for anyone who would rather not work directly with cell references.
The explanation matters more than the fix here, because understanding why a reference broke usually stops it from breaking again. Apply the suggested correction once the reason behind the error makes sense, and the guide to solving Excel errors works through the most frequent codes in detail. Including the cell reference in the request points AI straight at the problem.
7. Create dashboard elements
Deciding what belongs on a dashboard is one area where Copilot can provide planning guidance, so somebody building a sales dashboard for the first time can ask which tables, data, and charts to set up and get a suggested order for building it. The guide to AI data visualization goes further into layouts for anyone who wants a reference at this stage.
Before any building starts, a request to check an existing data set for errors helps confirm the numbers are sound, and a summary of what that data shows gives the layout a purpose. Building the charts and PivotTables stays a manual job, with the advice from the assistant acting as the plan. Starting with the dashboard goal, rather than the data, often leads to more useful guidance.
8. Create reusable workbook templates
Once a task repeats every month or quarter, the layout behind it is worth saving, and a description of what the sheet tracks can produce column headings, sample formulas, and a table structure to build on. Budget trackers, project trackers, planning sheets, Excel forecasts, expense reports, and invoice templates often use repeatable layouts, which makes them quick to draft and then adjust around the task.
Test the structure with real figures before it becomes the version a team relies on, since a layout that reads well can still miss a field everyone needs. Used this way, an AI spreadsheet generator creates an initial draft rather than a finished workbook, making it easier to adapt to a team’s needs. Listing the required columns in the request produces a closer first attempt.
Excel works as an AI-powered spreadsheet assistant to create, organize, and interpret data while keeping every suggestion available to check first. From budgets to inventory trackers, one single tool supports the whole workflow of building a spreadsheet, then cleaning, analyzing, and summarizing it.
For more on putting these ideas into practice, explore Excel AI tools or learn how to build budget planners and manage finances more efficiently.
Frequently asked questions
- Why does Copilot ask to “turn on AutoSave” in Excel?
Copilot works with spreadsheets saved to OneDrive or SharePoint, so the AutoSave button needs turning on before the Copilot button becomes available.
- What to do if data isn’t in table format?
Convert the data into a table using Format as Table, or ask Copilot to turn an unorganized range into a table ahead of analysis. The summary table guide works through that process in more detail, including what to do with an awkward range.
- What file types does Copilot support in Excel?
Assistance from Copilot in spreadsheets works with .xlsx, .xlsb, and .xlsm files, and older formats such as .xls do not currently work.
- Where to learn more about AI for Excel?
The AI for Excel page explains Copilot features across Excel in more detail, and the blog carries further guides on solving spreadsheet errors and creating summary tables.
- Can AI analyze Excel spreadsheets?
Trend descriptions, comparisons across periods, and results that may need a closer look all sit within what Copilot offers. Using AI in Excel for spreadsheet data analysis takes very little setup. Learning how to use AI to analyze Excel data starts with a clear question in the chat, followed by a check of the answer against the source figures.
- Can AI create an Excel spreadsheet?
Copilot can draft a starting workbook structure that includes column headings, tables, and suggested formulas. The result works as a template to review and refine rather than a finished spreadsheet ready to circulate.
- How can AI help in Excel?
Excel AI tools can suggest formulas, help clean up inconsistent data, describe trends, summarize a workbook, and draft a starting structure for a new sheet. These AI features in Excel run through Copilot, which answers requests typed in everyday language and returns suggestions to review before anyone applies them. The Excel AI features page sets out the full feature set for anyone deciding where to start.